The Woolworths Museum
Price Inflation 1909-2009
As part of the research for this site and the book "A Sixpenny Romance, celebrating a century of value at Woolworths", we reviewed published data from the Office of National Statistics, merging this with other sources from the former store-based company to collate a High Street price index for the chain's hundred years of trading.

 As part of the research for this site and the book "
This revealed that the original top price of 6D in 1909 equated to around £2.11 a century later. Without the addition of VAT from 1973, the original threepenny lines would have cost about £1 today and the sixpenny "luxuries" would be £2.
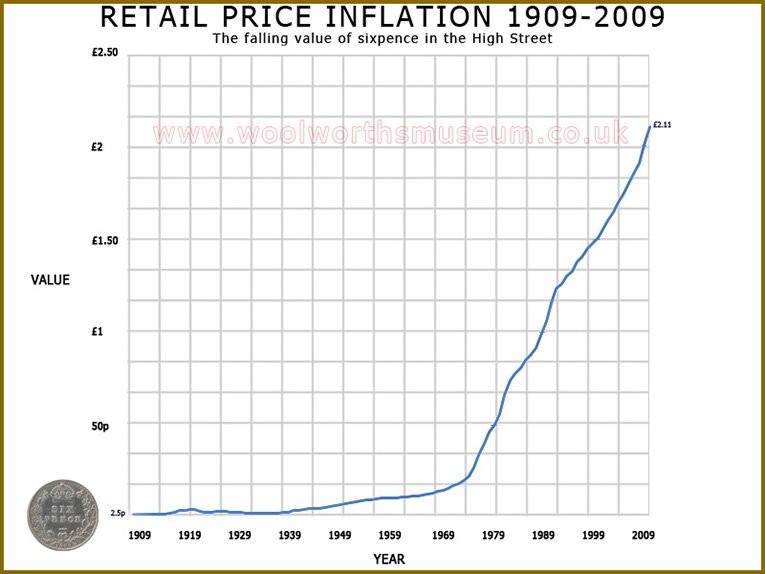
The chart above shows the comparatively low inflation in the first half of the twentieth century. This gave the infant British Woolworth company a head start, with rises during the Great War counter-balanced by deflation during the Great Depression of the 1920s. By 1929 the chain had grown to almost 400 stores, with unrivalled buying power. Factory mass production meant that sixpence at Woolworths bought much more in 1929 than it had twenty years before.
The second half of the century saw spells of hyper inflation, with prices rising by 20% or more in a single year. Underneath the top line statistics there were wide variations between different types of products, some driven upwards by major increases in fuel prices (which rose ten-fold between 1969 and 2009) and others falling back as a result of a switch to manufacturing in the developing world, increased competition and lifestyle changes at home.
Just as the economic scene had helped Woolworths in its early years, market forces in the twenty-first century accelerated the collapse of the chain's business model. The company's management failed to react to these changes, caught like a rabbit in the headlights:
- Woolworths Group relied heavily on CDs and DVDs for sales and profits in both its retail and wholesale divisions. The market declined rapidly in the 1990s and 2000s as customers switched allegiance to the Internet and Satellite television. In response retailers had to cut prices to compete with on-line rivals and to steal market share from other bricks and mortar stores. Between 1989 and 2008 the price of chart CD fell from £17.99 to £8.97, with a similar fall in DVD prices and the complete collapse of the singles market.
- The supermarkets' move into 'General Merchandise' (non food) saw strong competition for seasonal ranges, with (for example) the price of School Uniforms, falling rapidly in the Noughties. A grey charcoal skirt cost £7.99 in 1999 but only £3.00 in 2008. The same competition affected Easter Eggs, Summer Furniture and Barbecues, Toys and Christmas Seasonal Lines. Woolworths maintained share by lowering prices and by making their suppliers deliver more for less, but had to sell much more to make the same amount of profit. In pure numbers the chain sold four times more CDs and DVDs in 2007 than in 1997, but with many in the new 'Cheap Chart' selling for just £1 or £2.
- A comparison between the chain's Shoppers World Catalogue for Autumn/Winter 1978 and the Big Red Book for Winter 2008/2009 showed that more than half of the products had actually declined in price, even without taking inflation into account. Virtually every electrical item and bicycle had fallen in price, with many toys costing children less money than their parents a generation earlier.
Throughout the 2000s investors and employees were sold the merits of the Group's dominance of the Entertainment market - spanning retailing, wholesale and production - as a virtue. None realised how cash-hungry the operations had become and how vulnerable they were to a collapse in the credit insurance market. All received a salutary economics lesson when their share values and employment contracts were wiped out in the credit crunch of 2008.
The table below shows the Virtual Museum's retail price index, which is also available to download as a Microsoft Excel spreadsheet. Please cite woolworthsmuseum.co.uk as a source if you choose to use the information to advance your research and accept the contents with our compliments.
All figures on this page are shown in British Pounds (GBP). Until decimalisation in February 1971 the United Kingdom had a duodecimal currency, with 240 pennies (abbreviated 'D' from the Latin Denarii) in a pound. In other words sixpence was one fortieth of a pound. Since decimalisation there have been one hundred pennies (abbreviated 'p' for pence) in a pound.
Year |
Inflation % | Equivalent of 1909 Sixpence |
| 1909 | 1 | 0.0253 |
| 1910 | 0 | 0.0253 |
| 1911 | 1 | 0.0255 |
| 1912 | 1 | 0.0258 |
| 1913 | 2 | 0.0263 |
| 1914 | 1 | 0.0265 |
| 1915 | -1 | 0.0263 |
| 1916 | 12 | 0.0294 |
| 1917 | 23 | 0.0362 |
| 1918 | 18 | 0.0427 |
| 1919 | 10 | 0.0470 |
| 1920 | 6 | 0.0498 |
| 1921 | 0 | 0.0498 |
| 1922 | -18 | 0.0408 |
| 1923 | -10 | 0.0367 |
| 1924 | -5 | 0.0349 |
| 1925 | 9 | 0.0381 |
| 1926 | 0 | 0.0381 |
| 1927 | -1 | 0.0377 |
| 1928 | -3 | 0.0365 |
| 1929 | -5 | 0.0347 |
| 1930 | -8 | 0.0319 |
| 1931 | -6 | 0.0300 |
| 1932 | -4 | 0.0288 |
| 1933 | -2 | 0.0282 |
| 1934 | 0 | 0.0282 |
| 1935 | 1 | 0.0285 |
| 1936 | 4 | 0.0297 |
| 1937 | 2 | 0.0303 |
| 1938 | 8 | 0.0327 |
| 1939 | 12 | 0.0366 |
| 1940 | 15 | 0.0421 |
| 1941 | 12 | 0.0471 |
| 1942 | 8 | 0.0509 |
| 1943 | 4 | 0.0530 |
| 1944 | 0 | 0.0530 |
| 1945 | 2.5 | 0.0543 |
| 1946 | 6.5 | 0.0578 |
| 1947 | 15 | 0.0665 |
| 1948 | 8 | 0.0718 |
| 1949 | 8 | 0.0775 |
| 1950 | 2 | 0.0791 |
| 1951 | 6 | 0.0838 |
| 1952 | 10 | 0.0922 |
| 1953 | 6 | 0.0977 |
| 1954 | 4 | 0.1017 |
| 1955 | 2 | 0.1037 |
| 1956 | 3 | 0.1068 |
| 1957 | 2 | 0.1089 |
| 1958 | 1 | 0.1100 |
| 1959 | 1 | 0.1111 |
| 1960 | 1 | 0.1122 |
| 1961 | 2 | 0.1145 |
| 1962 | 3 | 0.1179 |
| 1963 | 2 | 0.1203 |
| 1964 | 2 | 0.1227 |
| 1965 | 4 | 0.1276 |
| 1966 | 5 | 0.1340 |
| 1967 | 4 | 0.1393 |
| 1968 | 5 | 0.1463 |
| 1969 | 5 | 0.1536 |
| 1970 | 6 | 0.1628 |
| 1971 | 8 | 0.1759 |
| 1972 | 6 | 0.1864 |
| 1973 | 10 | 0.2050 |
| 1974 | 12 | 0.2296 |
| 1975 | 20 | 0.2756 |
| 1976 | 25 | 0.3445 |
| 1977 | 18 | 0.4065 |
| 1978 | 15 | 0.4674 |
| 1979 | 8 | 0.5048 |
| 1980 | 12 | 0.5654 |
| 1981 | 18 | 0.6672 |
| 1982 | 11 | 0.7406 |
| 1983 | 5 | 0.7776 |
| 1984 | 4 | 0.8087 |
| 1985 | 5 | 0.8492 |
| 1986 | 3 | 0.8746 |
| 1987 | 5 | 0.9184 |
| 1988 | 7 | 0.9827 |
| 1989 | 8 | 1.0613 |
| 1990 | 9 | 1.1568 |
| 1991 | 7 | 1.2378 |
| 1992 | 2 | 1.2625 |
| 1993 | 3 | 1.3004 |
| 1994 | 2 | 1.3264 |
| 1995 | 4 | 1.3795 |
| 1996 | 2 | 1.4070 |
| 1997 | 3 | 1.4493 |
| 1998 | 2 | 1.4782 |
| 1999 | 2 | 1.5078 |
| 2000 | 3 | 1.5530 |
| 2001 | 3 | 1.5996 |
| 2002 | 3 | 1.6476 |
| 2003 | 3 | 1.6970 |
| 2004 | 3 | 1.7480 |
| 2005 | 3 | 1.8004 |
| 2006 | 3 | 1.8544 |
| 2007 | 3 | 1.9100 |
| 2008 | 5 | 2.0055 |
| 2009 | 5 | 2.1058 |